
In a world where investors are constantly on the lookout for better returns, frontier markets can provide a unique mix of growth potential, event-driven opportunities and diversification benefits for both emerging markets and global investors.
What is frontier debt?
Frontier debt is comprised of debt issues from jurisdictions that are typically in the early stages of economic and institutional growth. These countries are usually less developed than mainstream emerging market (EM) countries and their debt markets can be narrower, less liquid and have fewer issuances. However, they can offer unique, high-conviction opportunities for generating alpha due to their high carry and attractive risk-return profiles.
Although there isn’t a uniform definition for the asset class, one could refer to the J.P. Morgan Next Generation Markets (NEXGEM) Index, which includes sovereign bonds “that are just beginning to appear on the radar of traditional EM investors”. That index’s criteria include a credit rating of Ba1/BB+/BB+ or lower by Moody’s, S&P and Fitch, respectively, and a weighting of less than 2% in the much larger EMBI Global Diversified Index.1 Using those parameters, prominent sovereign jurisdictions include Sub-Saharan Africa, South Asia, Central America and a number of former Soviet republics (Exhibit 1), as opposed to the more established emerging market countries such as Mexico, Indonesia, Saudi Arabia and Turkey, for example.
The NEXGEM Index is expected to receive a facelift in 2025 to include income per capita criteria and will likely also see the addition of more frontier sovereign issuers including Argentina, Ecuador, Egypt, Kazakhstan and potentially Ukraine. Although these indices are comprised of sovereigns, there is also a broad—and growing—set of corporate bond issuers operating in these countries that can offer more nuanced approaches to frontier markets via exposure to multiple jurisdictions in some instances and targeted exposure to specific economic sectors.
Exhibit 1: Regional split of frontier markets sovereign debt
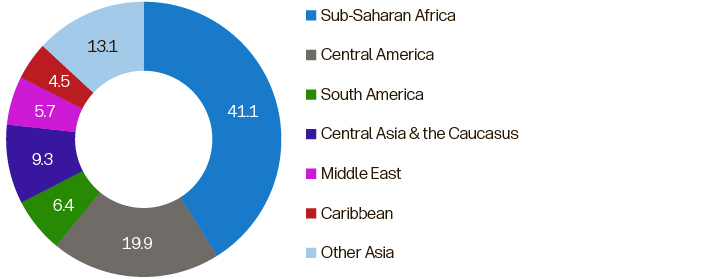
Exhibit 2: Frontier and US high yield debt:
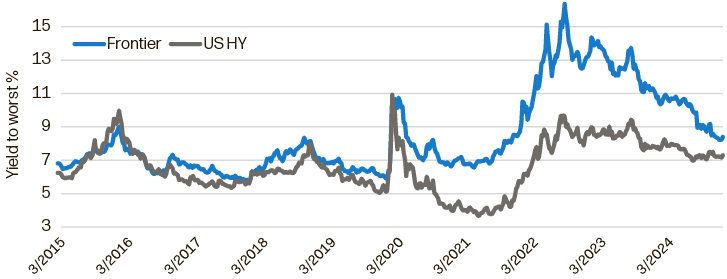
Past performance does not predict future returns. Sources: J.P. Morgan, Bloomberg. Data from March 6, 2015 to March 6, 2025. Includes the following indexes: “Frontier debt” is represented by the J.P. Morgan Next Generation Markets Index Composite Index; “US high yield” is represented by the Bloomberg US Corporate High Yield Index.
There were a few high-profile sovereign casualties in the perfect storm endured by fixed income markets from 2020 through 2022. However, in recent years, there have been encouraging precedents set by both sovereign and corporate issuers alike. These include, for example, deleveraging, diversifying their sources of financing and market-friendly reforms. That should bode well for that segment of the market as we head into a tumultuous 2025.
Are investors being paid for the risks?
Frontier debt all-in yield levels remain moderately attractive, even if the pick-up relative to US high yield debt is near historic median levels (Exhibit 2).2 In addition, there are several interesting bottom-up opportunities that could complement broader portfolios. With trade and other conflicts set to dominate the headlines during 2025, there will likely be winners and losers in the bond market for nimble investors to derive value from and which should, relative to more established emerging markets, trade more on their own fundamentals rather than on broad macroeconomic trends.
Frontier debt does equate to higher risk and that is reflected in its lower credit ratings. For example, five sovereigns defaulted on their external debts during the 2020 to 2022 crisis period, though notably those defaults did not have direct implications for corporate issuers from those countries.3
The reasons varied but included a reliance on ready access to external funding in the absence of a developed local debt market, conflict and, in some cases, economic trajectories that were already troubled before the sharp pandemic-induced downturn in activity.
Yet the number of defaults markedly undershot initial expectations, as bilateral and multilateral lenders such as the International Monetary Fund (IMF) stepped in. As a result, sovereigns exhibiting high levels of stress—for example Egypt, Kenya and Pakistan—remained current on their debt service until economic activity rebounded.
Still, frontier debt certainly does come with its own risks, particularly when compared to traditional emerging markets debt. For example (and not limited to):
- Shallow domestic markets mean frontier markets are more reliant on external financing and as a result tend to be more sensitive to periods of tighter global financial conditions and pressures in foreign exchange markets stemming from currency mismatches between government revenues and outstanding debts.
- Political risks are more prevalent, often stemming from lower checks and balances on leadership and brinkmanship that may impede market-friendly reforms. For example, Nigeria’s Petroleum Industry Bill, which was signed in 2021, was the culmination of a 20-year effort to reform the oil and gas sector in an effort to make it more conducive to investment.4 That protracted period of uncertainty led to underinvestment, declining production and tax revenues.
- Given this subset of emerging markets debt is still developing, the debt is more thinly traded, which can result in sharper drawdowns during periods of market stress due to market technicals rather than due to an actual higher default risk. That’s why it’s a good idea to look for sovereign and corporate exposures one is confident will hold throughout the economic cycle, rather than just in the short-term.
Exhibit 3: Selected fixed income asset classes: Annualized return vs. volatility during the past 10 years
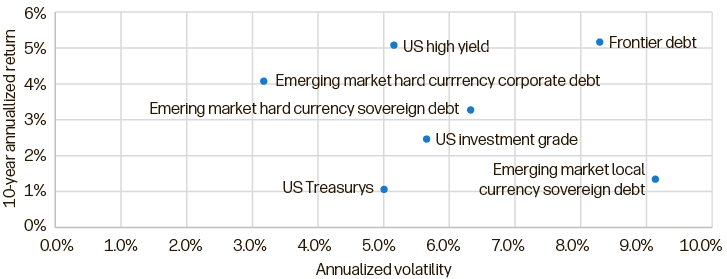
Frontier debt has historically compensated investors for these higher risks with a higher return (Exhibit 3) and Sharpe ratio relative to other emerging markets debt asset classes.
In addition, frontier debt—in many cases—has long-term structural tailwinds, including:
- A young and growing working-age population, which in turn may fuel higher domestic consumption and provide a longer runway for economic growth. Established emerging markets such as China, Brazil and Mexico no longer have this demographic dividend as the average age of the workforce matures. The composition of the population is crucial for this long-term tailwind, as shown in Exhibit 4, where select frontier markets such as Nigeria, Pakistan and Uzbekistan are forecast to have a much higher share of their populations within working age.
- Other drivers are needed alongside demographics to unleash this potential, including infrastructure investment, sound policy, a diversifying economy and strong institutions. These are key differentiators between many frontier markets. However, together, and despite the uncertain global macro backdrop today, the IMF’s latest GDP growth projections for 2025 to 2026 forecasts accelerating growth in “low-income developing countries” of between 4.6% and 5.4%. In contrast, advanced economies and emerging markets have more stable, but lower growth rates.5
- Many countries issuing frontier debt have abundant natural resources that can be monetized with the proceeds devoted—with the right reforms in place—to developing the essential infrastructure that’s needed to harness private investment and create a more idiosyncratic credit story.
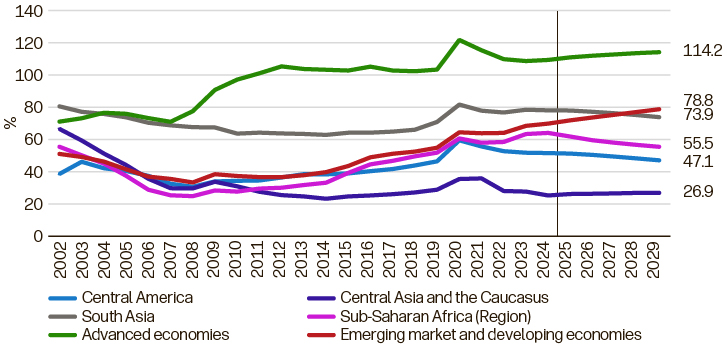
- Stable —or declining—debt/GDP ratios, which compare favorable to the increasing debt burdens in many advanced economies and in more established emerging market countries (Exhibit 5).
Exhibit 4: Dependency ratio: 1950 to 2100 of select countries

Exhibit 5: Government gross debt relative to GDP
Where do corporate bond issuers fit in frontier markets?
These advantages can also hold true for corporate debt. For example:
- Banks and telecommunications companies in Eastern Europe have been issuing more corporate debt and are the thrust behind financial inclusion via their expansion of network coverage, digital payment services and micro loans for enterprise. Growth in these enterprises is due in part to tailwinds from demographics and a growing middle class in those regions.
- Commodity exporters typically conduct their business in US dollars and, as a result, are shielded from local currency volatility. In addition, given their meaningful role in generating government revenues, they often benefit from stable fiscal terms, which can safeguard them from sovereign stress and capital controls. That was certainly the case for many corporate issuers operating in Sub-Saharan African countries, which saw distressed sovereign bond pricing in between 2020 and 2022.
- Corporate issuers with sound credit metrics can be found, with low leverage, high interest coverage and high cash to short-term debt ratios relative to their similarly rated peers in more developed countries. In addition, solid fundamentals can protect businesses from intermittent bond market access and higher-for-longer yields.
What’s frontier debt’s role heading into 2025?
Frontier market debt notched solid gains in 2023 and 2024, returning 21% and 11%, respectively.6 Although much of the low-hanging fruit may have already been harvested, there remains reason for optimism over the medium-term with yields still north of 8%. The prospect of renewed scrutiny on trade flows, tariffs being imposed by multiple trading blocs and the consequent impact on supply chains, economic activity and inflation over the next four years is a headwind at the forefront of global investors’ minds.
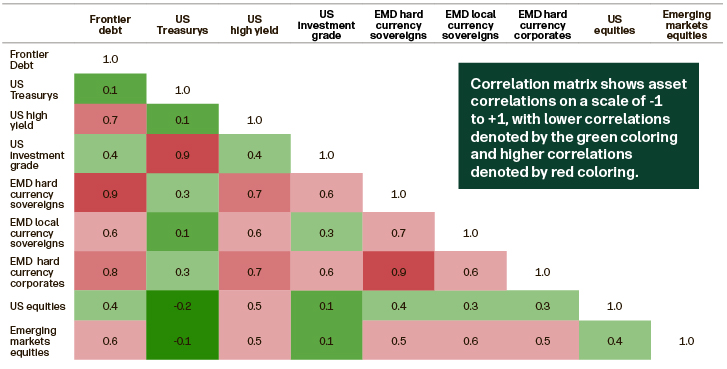
Frontier debt can also offer high-conviction, idiosyncratic and event-driven opportunities that can reduce a portfolio’s “beta”(i.e., its sensitivity to global macroeconomic factors) and serve to capitalize on less-correlated credits. As Exhibit 6 shows, during the past decade, frontier market sovereigns have shown low correlations to US Treasurys and lower correlation to US equities. If rising long-dated US Treasury yields are a concern, investors can seek the total return prospects from shorter-duration, more fundamentally driven, credit performance via frontier debt investments.
Exhibit 6: Key correlations over past decade
Global trade pressures
Pressure from potentially higher trade frictions are likely lower for frontier debt companies than for companies in broader, traditional emerging market countries due to the former’s typically lower reliance on trade. For example, for South Asia and Sub-Saharan Africa, trade is 43% and 59% of each region’s GDP, respectively compared to, for example, Mexico (73%), Korea (88%) and Romania (83%).7 There are also frontier market sovereign and corporate debt issuers that may benefit from new near-and re-shoring trading trends that emerge as larger exporters navigate the channels to end consumers in an effort to sidestep tariffs, as we saw during prior instances of deglobalization.
More positively, frontier debt may also be more directly exposed to the ripple effects of peace deals in conflicts in Ukraine and the Middle East. For instance, for issuers in the Caucasus, Central Asia and the Middle East (which collectively comprise roughly 14.5% of the NEXGEM Index), are likely to see their funding sources broaden and costs decline as both existing concerns encompassing proximity to conflict dissipate and new investment grows. We have already seen several new debt issuers from Central Asia and Eastern Europe in the past year as confidence builds.
Taking the time to undertake bottom-up research in frontier markets has been a fruitful source of performance generation for some fixed income investors in recent years, particularly in those areas that have seen higher levels of geopolitical stress.
We believe bonds often exhibit undue levels of political premium relative to their underlying fundamentals due to low levels of participation by investors. And while we recognize that many sectors within frontier market debt have performed strongly in recent quarters, we believe that a continued, carefully selected number of frontier sovereign and corporate bond issuers may be a beneficial diversifier, due to the potential for high yields and low correlation. Perhaps not during 2025, but in the near future, there is the potential for debt-raising activities to fund reconstruction in Ukraine should current efforts by parties to come to a negotiated peace deal bear fruit. With the World Bank estimating reconstruction costs of $524 billion, corporate issuers within Ukraine and the surrounding region will almost certainly need bond investors to play a proactive role to finance new investment.8
2As of March 6, 2025, the 1.1% yield difference between frontier debt (using the J.P. Morgan Next Generation Markets Index yield to worst of 8.4% and the Bloomberg US Corporate HY Index yield to worst of 7.3%) is in the 50th percentile in the context of the past 10 years.
3Ghana, Lebanon, Sri Lanka, Suriname and Zambia. We exclude Belarus and Russia due to sanctions induced.
4Kasirim Nwuke, "Nigeria's Petroleum Industry Act: Addressing Old Problems, Creating New Ones," Brookings Institution, November 24, 2021.
5International Monetary Fund, "World Economic Outlook Update, January 2025: Global Growth: Divergent and Uncertain," January 2025.
6As measured by the J.P. Morgan Next Generation Markets Index. It is not possible to invest directly in an index. All investments contain risk and may lose value.
7World Bank Group, “Trade (% of GDP), annual data as of year-end 2023.
8"Updated Ukraine Recovery and Reconstruction Needs Assessment Released," World Bank, February 25, 2025.
Author